Using ZeronThe dashboardMenu
The dashboard
Everything happens on one page. The left column is what Zeron is doing; the right side is your totals and the tabs.
The loop card#
Top left. While a loop runs, it shows the pair (which exchange is long, which is short), the asset, the size of each side and a countdown to when it closes on its own. Between loops, it shows when the next one starts.
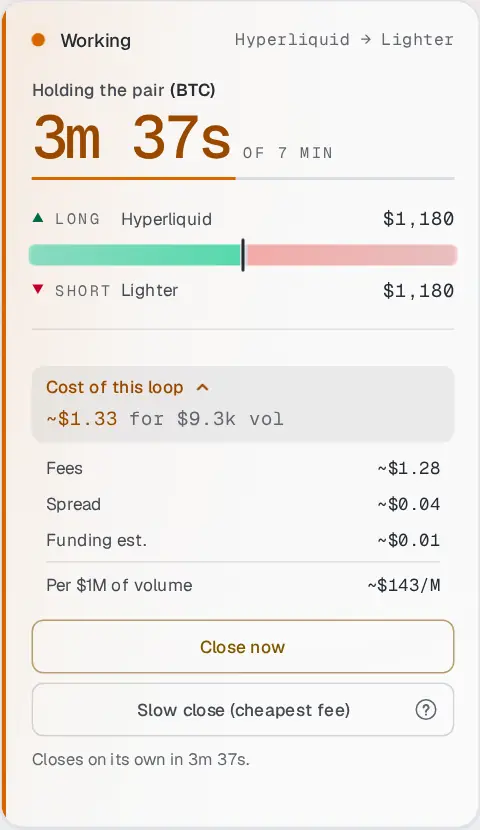
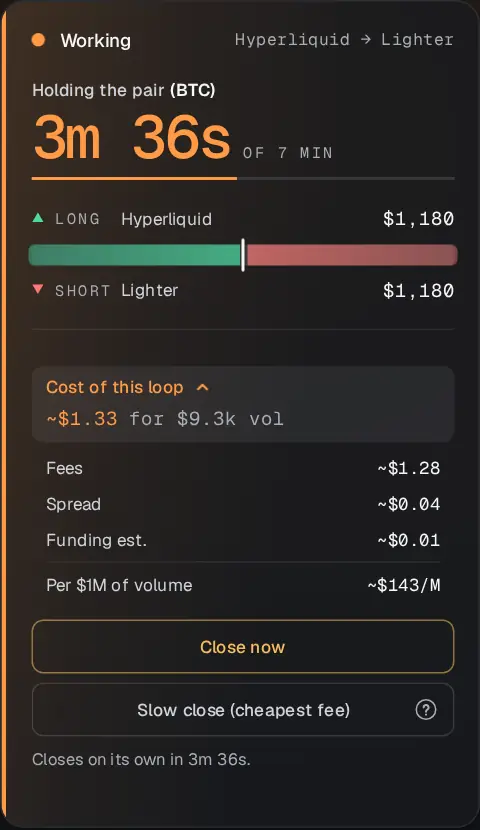
- Cost of this loop
- What the loop should cost, split into fees, spread and funding, next to the volume it makes and the cost per $1M. A ~ means it is an estimate. Press it to open or fold the detail.
- Close now
- Closes both sides straight away, at the market price.
- Slow close
- Tries a limit order three times, then closes at the market price. Slower, and usually cheaper.
The autopilot card#
- Autopilot
- The on / off switch. On, Zeron runs loops on its own. If something is missing, it stays paused and a link lists what to fix first.
- Run semi-automatic now
- Runs one loop right away, by hand. Under it, how many hand-launched runs you have left today on your plan.
- Help me
- Replays a short guided tour of the dashboard.
The weekly volume card#
The one number you set: how much volume Zeron makes for you each week, for all your exchanges together. Switch between Volume and Fees to set it in whichever you think in; the other figure is shown right under it. Weekly volume, in detail.
Your totals#
Four cards along the top. The switch above them picks the period: 7D or 24H. All time is written next to it.
- Volume
- Trading volume your exchanges confirm over the last period you picked, buys and sells together.
- Fees
- What the exchanges charged you over the last period you picked. The bar shows this week's budget used.
- Volume on track
- An estimate of the volume your ticked exchanges will reach. It changes when you tick one.
- Fees per $1M
- What each $1M of trading really cost you over the last period you picked. Lower is better.
Every ? on the dashboard opens a one-line explanation like these.
Banners at the top#
A band across the top of the page tells you when Zeron is paused, when an update is going out, or when a maintenance is planned (with the time, in UTC). During an update, nothing new starts and it resumes on its own a few minutes later. Running loops finish normally.
Below: the tabs#
Under the totals sit the tabs: Perps, CPM, Activity, Agent, Logs and a few more. Each tab, one by one.